Sunday, August 4, 2013

RDII or Tri Triangular Unit Hydrograph in InfoSewer

Subject:  RDII or Tri Triangular Unit Hydrograph in InfoSewer

The RDII method in InfoSewer is similar to the RDII or RTK  method in  InfoSWMM with some differences.    The RTK data for triangles 1, 2 and 3 are defined in the Unit Hydrograph but instead of individual R values, the overall R is set and the Percent R1,  R2 and R3 are defined based on the total  R.  R3 is calculated internally as 100 – R1 – R2.   Each loading manhole with RDII flow has a total  area, a hyetograph and a Unit Hydrograph.  The hyetograph has to be set at multiples of the unithydrograph, so you can define the time or X columns with integers and then use the Block Edit command to change X to minutes by multiplying  by the Unit Hydrograph time (Figure 1).   You can use only one component if you set R1 or R2 to 100 percent or R3 to 100 percent by setting R1 and R2 to 0 percent (Figure 2).  The overall area of the Unit Hydrograph is divided amongst the loading manhole using the Subbasin Area (Figure 3).   The storm flows generated can be viewed using a Group Graph (Figure 4).

Figure 1.   Hyetograph Curve for the RDII Unit Hydrograph


Figure 2.  The Unit Hydrograph is defined for various values of R, R1,  R2, T1,  T2,  T3, K1,  K2 and  K3.


Figure 3.  The Unit Hydrograph and Hyetograph are tied to a particular loading manhole using a Subbasin Area.


Figure 4.  The Unit Hydrographs that are generated can be viewed using a Group loading Manhole Graph.  The R1, R2 and R3 have only one triangle.
 .

How InfoSWMM and H2oMAP SWMM Reads CUHP Hydrographs

Note:  The Colorado Urban Hydrograph Procedure (CHUP) 2010 version generates a SWMM 5 Inflows Files containing a time series of flow inflows for 1 to many nodes (Figure 4 and Figure 5).    The created Inflows file (Figure 2) can be imported intao InfoSWMM and H2MAP SWMM without any alteration by using the Files command in Run Manager (Figure 1) and graphed using the Output Manager of InfoSWMM and  H2OMAP SWMM (Figure 3).


Figure 1.  Location of Files Command in Run Manager


The inflows will be read  from the Inflows file, which has this format:


Figure 2.  Header format of the CUHP Exported Hydrograph File

InfoSWMM and H2oMAP SWMM will match the Node Names in the Inflows file to the network node names and import and interpolate the inflows based on the Inflows time step and your hydraulic time step to generate Lateral  Inflow Hydrographs

Figure 3.  InfoSWMM and H2OMAP SWMM Lateral  Inflow Hydrographs

Figure 4.  CHUP Inflows File Descrpiption in the CUHP manual.
Figure 5. Cover of CUHP 2005 User Manual from 2010

How to Find the Proportional loading to a link or manhole in InfoSewer

Subject:  How to Find the Proportional loading to a link  or manhole in InfoSewer

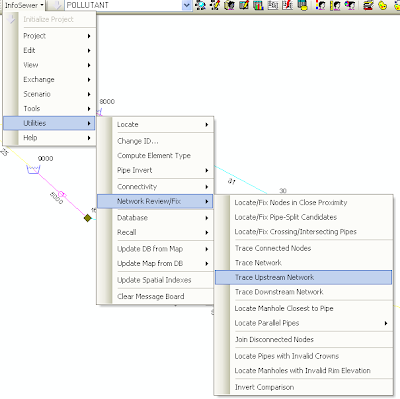
You can use the Upstream Trace tool in InfoSewer to find the upstream nodes and links from any link in InfoSewer.   Once you have the upstream traced network then assing the traced upstream nodes and links to the  domain.  Once you have the domain then these steps will allow you to calculate the proportion of flows from each upstream node and map the proportion using Map Display.

Step 1.  Use the Tool Trace Upstream Network to find and make a Domain out of the Traced upstream Network


Step 2.  The Traced Upstream Network


Step 3.  Use the created domain in Output Report Tabular Reports


Step 4.  Copy the ID and Total Flow from the Loading Manhole Report


Step 5.  Use the Domain in the DB Table Manhole Infomation


Step 6.  Create a new information field called Proportion for example


Step 7.  Map the new data field proportion using Map Display


Step 8.  Now you have a Map Display of the Proportional loading to a link  or manhole in InfoSewer


Step 9.  40 percent of the flow comes from one node an the other 60 percent comes from the other node to the link with a d/D over 0.5.


How to Use Bing Maps in InfoSWMM as a Basemap

Note:   How to Use Bing Maps in InfoSWMM as a Basemap

A great feature of Arc GIS 10 is the ability to use background maps from Bing for your model.  A few steps are necessary to set up the coordinates, import the basemap, clip the basemap and set the new extents:

Step 1.  Set the Current Coordinate System for the intended network.


Step 2.  Add the Aerial Basemap from Bing Maps.


Step 3.  The Base Map has to be clipped and zoomed.


Step 4.  Zoom to your network and clip the rest of the Map out of the Maximum Extents.


Step 5.  Set the Maximum Extents of your Network using the Data Frame Tab in Data Frame Properties.


Step 6.  You can also set the background color for the area outside of the clipped Base Map if you so desire using the Frame Tab.


Step 7.  You now can add nodes and links and view the locale using Google Street View or other using the Tools Prefences.


Weather Infographics

How is the Maximum Link Flow Applied in SWMM 5?


Subject:  How is the Maximum Link Flow Applied in SWMM 5?

The maximum flow limit for a link applies to the kinematic wave and the dynamic wave solution.   The inflow to the link  in the kinematic wave solution is limited (Figure 1) but the calculated link flow is limited in the dynamic wave solution after the link flow (Figure 2):

1.       Is checked using the Culvert Inlet Equations (optional)
2.      The normal flow equation is checked (internally optional depending on the Normal flow options) and
3.      The Picard iteration solution under relaxation parameter (always 0.5) is applied (Figure 3).

Figure 1.  Kinematic Wave Solution Limits the Inflow to  the Link Maximum limit.
Figure 2. Dynamic Wave Solution link  flow limit.
Figure 3.  The Link  flow in the dynamic wave solution has three checks at each iteration in a time step.

How to Make Contours in InfoSWMM and H2oMAP SWMM

Subject:  How  to Make Contours in InfoSWMM and H2OMAP SWMM

It is easy to make contours out of node input data or node output data in InfoSWMM and H2oMAP SWMM using the Contour Tool in the Contour Tab of the Attribute Browser.  You can control the resolution and the type of smoothing for the created contour (Figure 1).  If you haveInfoSWMM Suite you can use the Contour to DEM command in the Subcatchment Manager to convert the created Contour to an Elevation or DEM file (Figure 2 and Figure 3).   The Layer properties for the created elevation can be altered in Arc GIS to make a better visual depiction of the elevation (Figure 4).

Figure 1.  Contour Tool in the Contour Tab of the Attribute Browser.

Figure 2.  Contour to DEM command in the InfoSWMM Subcatchment Manager will convert the created Contour to an Elevation or DEM file.


Figure 3.  Convert the Value Field and  NOT the level Field of the contour.

Figure 4.  The Arc GIS Layer properties can be used to alter the default color ramp and the number of classes used in the color ramp.

InfoSWMM and H2OMap SWMM Facility Manager

The InfoSWMM Facility Manager offers the knowledgeable engineer complete control what elements are simulated in her or his model.  You can make active or inactivate elements based the type of Network Element, A Network Path, A Mouse Drawn Map Selection, The Domain, A selection set, a DB Query, a Query Set and a Special Query.  You can make the simulated network smaller or larger depending on your simulation or calibration requirements.  For example, you can have a whole basin network but model only a branch or a subset of the network if you are using the Calibrator or Designer Addons.


InfoSWMM and H2Map SWMM Selection Set and Domain Manager

Subject:   InfoSWMM and H2Map SWMM Selection Set and Domain Manager

You can use the Domain to easily make selection sets using these two steps.  You make a Domain which is the areas of the network you are interested in at the current time and then save your Domain of Interest in a Selection Set.

Step 1:  Go to Domain Manager and use Map Selection, Query or the Network to make a domain

Step 2.  Go to Selection Sets in the Operation Tab of the  Attribute Browser and make a New Set and load the domain into your set.


How to make a shape file from a Output Relate in InfoSWMM

Note:   How to make a shape file from a Output Relate in InfoSWMM

Step 1.  Make an Output Relate for the Conduit Summary Table using the Operation Tab in Attribute Browser.


Step 2:  Using the GIS Gateway you can save q/Q and d/D to a shape file that can then be added to the Arc GIS Table of  Contents


Step 3.   You now have a Shape File for the value of q/Q or Flow over Full Flow.  You can also use the Symbology Tab in Data Properties to color and/or make bar charts and bubble charts from the summary q/Q and d/D values during the simulation for each link.


Sensitivity Analysis in InfoSWMM and H2OMAP SWMM

Subject:  Sensitivity Analysis in InfoSWMM and H2OMAP SWMM   
  
It is easy to perform sensitivity analysis in InfoSWMM and H2oMAP SWMM using the Scenario Manager, Dataset manager, Block Edit in the Database Editor, Batch Simulation and theReport Manager.  For example, we will do a sensitivity analysis for the Subcatchment Width (one the physical parameters in the Subcatchment analysis of SWMM 5 – see Figure 1).  The width is normally the area divided by the overland path length but there are many common means of calculating the width.  

Figure 1.  Physical Data used in the Calculation of Surface Runoff using the Non Linear Reservoir Routing method in SWMM 5.


Figure 2.  The base scenario for our sensitivity analysis.

There are seven main steps in the sensitivity analysis of the width:

Step 1.   Use the Scenario Explorer to make Child Scenarios from the Base Scenario.  For ease of understanding we will name each of the Child Scenario's the percent change in the width parameter.  Thus, W-50, will be the Base Width Plus 50 percent.


Step 2.   Use the Dataset Manager to create different Subcatchment Sets that will be used for each of the Scenario's.  Again for ease of understanding we will use the name S_W+50 etc for the Sets to match the change in the Width Parameter.


Step 3.   Use the Scenario Manger to choose the right Subcatchment Set for Each Scenario.


Step 4.   Use the Database Editor to Edit and modify the Width of Each Subcatchment Set.


Step 5.   Use the Block Edit tool to multiply the Base Width Value by the needed value, 1.25, 1.50, 0.75, 0.50


Step 6.   Use the Batch Simulation Command to run all of the Scenario's.


Step 7.   Use Report Manager and the tool Compare Graphs to graph the results of Each Scenario together.


Step 8.   In Report Manager you can produce a table that shows the runoff for each of the different scenarios.


Pump Volume per Pump Event in SWMM 5

Subject: Pump Volume per Pump Event in SWMM 5

You can calculate the volume per startup event by using the Pump Summary Table in SWMM 5 and copying a few columns to Excel.   


1.   Go to the Pump Summary
2.   Copy Pump Name, Total Volume and Pump Startups to Excel
3.   Divide to get Pump Volume per Event

You will now have the average volume per event.


Pump
Total
Total Volume
Pump
Name
Volume (ML)
Per Event
Startups
PUMP-11
0.006082
202.73
30
PUMP-13
0.005539
184.63
30
PUMP-15
0.006241
208.03
30
PUMP-17
0.0064
213.33
30
PUMP-19
0.005405
180.17
30
PUMP-21
0.006199
206.63
30
Inc.

InfoSWMM: A 2030 AI-Assisted Study Guide

  InfoSWMM: A 2030 AI-Assisted Study Guide delete   InfoSWMM: A 2030 AI-Assisted Study Guide A comprehensive study guide for someone in 2030...