The Power or Graphics in InfoSWMM and H2OMap SWMM
·
September 10, 2016
How to Tell how Long Normal Flow is used in a Link in #InfoSWMM, H2OMap SWMM w/ #SWMM5
·
December 16, 2015
How to Tell how Long Normal Flow is used in a Link in #InfoSWMM, H2OMap SWMM w/ #SWMM5
Find the Fraction of Normal Flow Limited in the Flow Classification Table and copy it to the Link Information Table - the value of FLM can then be Displayed in a Map using the Map Display command. In this small example, three links primarily used normal flow and one uses it for a short time. Normal flow only uses the Manning's equation and the link upstream depth, hydraulic radius and cross sectional area to compute the flow.
New - Five Infiltration Options Now in InfoSWMM v14 and H2OMap SWMM v14 for Watershed Modeling
·
November 14, 2015
Infiltration from the pervious area is a marvelous and from a runoff volume and runoff peak perspective a vital process in modeling the hydrology and ultimately the hydraulics of your Watersheds. Figure 1 shows the five options available in InfoSWMM and H2OMap SWMM after the version 14 update which was based on the EPA SWMM 5.1.010 release:
Not only can you have a different Infiltration option per Model Simulation but you can have different options for each scenario and even for individual Subcatchments in a Scenario (Figure 2). In #InfoSWMM and H2OMap SWMM the Soil DB table (Figure 3) shows the individual parameters that apply to Horton, Green Ampt and Curve Number infiltration. The Modified Horton and Green Ampt have the same parameters as the Horton and Green Ampt Soil Types. The Soil Coverage is specified in the Subcatchment DB Table or individually in the Subcatchment Attribute Browser (AB) as shown in Figure 4. You can also see the infiltration losses for either multiple Subcatchments or for one Subcatchment across many scenarios using the Advanced Reference Graphics Analysis in Innovyze’s InfoSWMM and H2OMap SWMM (Figure 5).
| Figure 5. The feature rich Output Report Manager allows complete customization of the graphs using other scenarios, calibration data and other other output elements. |
#INFOSWMM Genetic Algorithm Suite Programs Calibrator and Designer
·
October 04, 2015
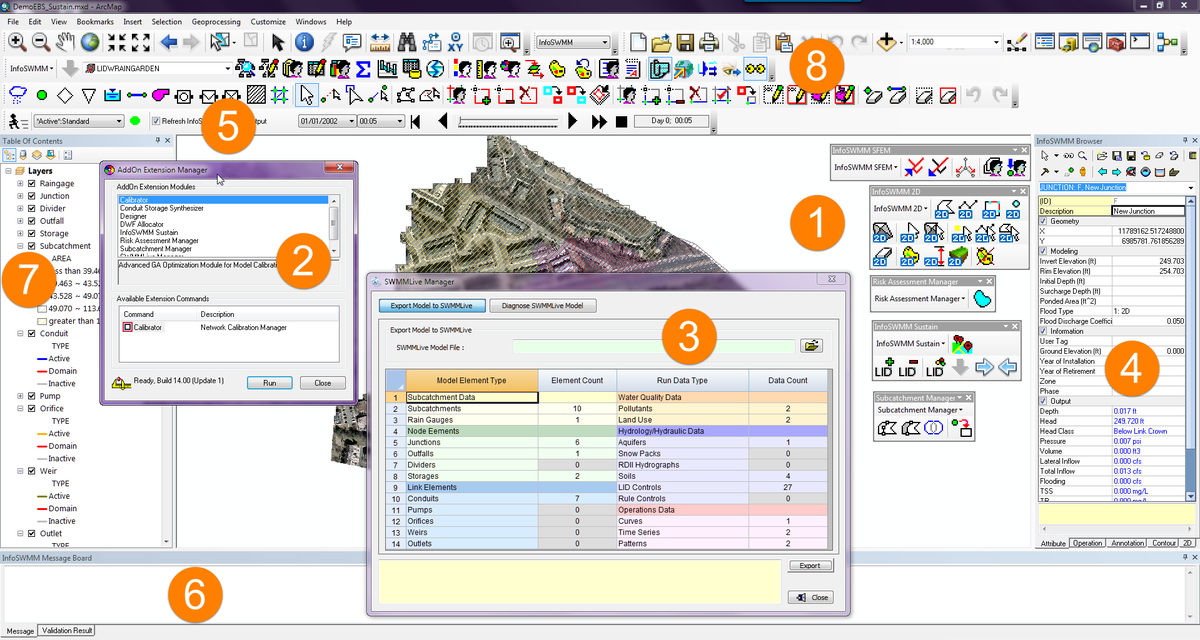
#INFOSWMM Genetic Algorithm Suite Programs Calibrator and Designer w/ #GA Options pic.twitter.com/K7cMzVsRXE
— Robert Dickinson (@InnovyzeRobert) October 4, 2015
Components of #INFOSWMM from @Innovyze
·
October 04, 2015
Tweets - Components of #INFOSWMM from @Innovyze
- 1 retweet0 favorites
- 2/ Components of #INFOSWMM from @Innovyze Genetic Algorithm Components Bullet Two #DESIGN #CALIBRATOR1 retweet1 favorite
- 1 retweet1 favorite

0 retweets0 favorites


Robert Dickinson 


